
• Link to X
  • Link to LinkedIn
VerdeWatts
  • MicroGrid Systems
    • MobileWatts™
  • Energy Solutions
    • Energy Storage
    • Power Purchase Agreement
    • Net Zero Carbon & LEEDs
    • Smart Digital City
    • EnerSync Power Hub
  • About
    • VerdeWatts Blog
    • Energy Information Resources
  • Contact Us
  • Click to open the search input field Click to open the search input field Search
  • Menu Menu
Home1 / News & Energy Perspectives2 / Energy News3 / U.S. Solar Production Booming for 2024 YTD

U.S. Solar Production Booming for 2024 YTD

Energy News

Last year, the US’s Energy Information Agency (EIA) forecast that over half (54%) of new electric-generating capacity would be solar, with a lot of it coming online near the end of the year for tax reasons. The EIA recently released electricity generation numbers for the first five months of 2024, and those numbers show that the expected solar power construction boom is well underway: generation by solar power has increased by 25 percent compared to the same time period (January – May) just one year earlier.
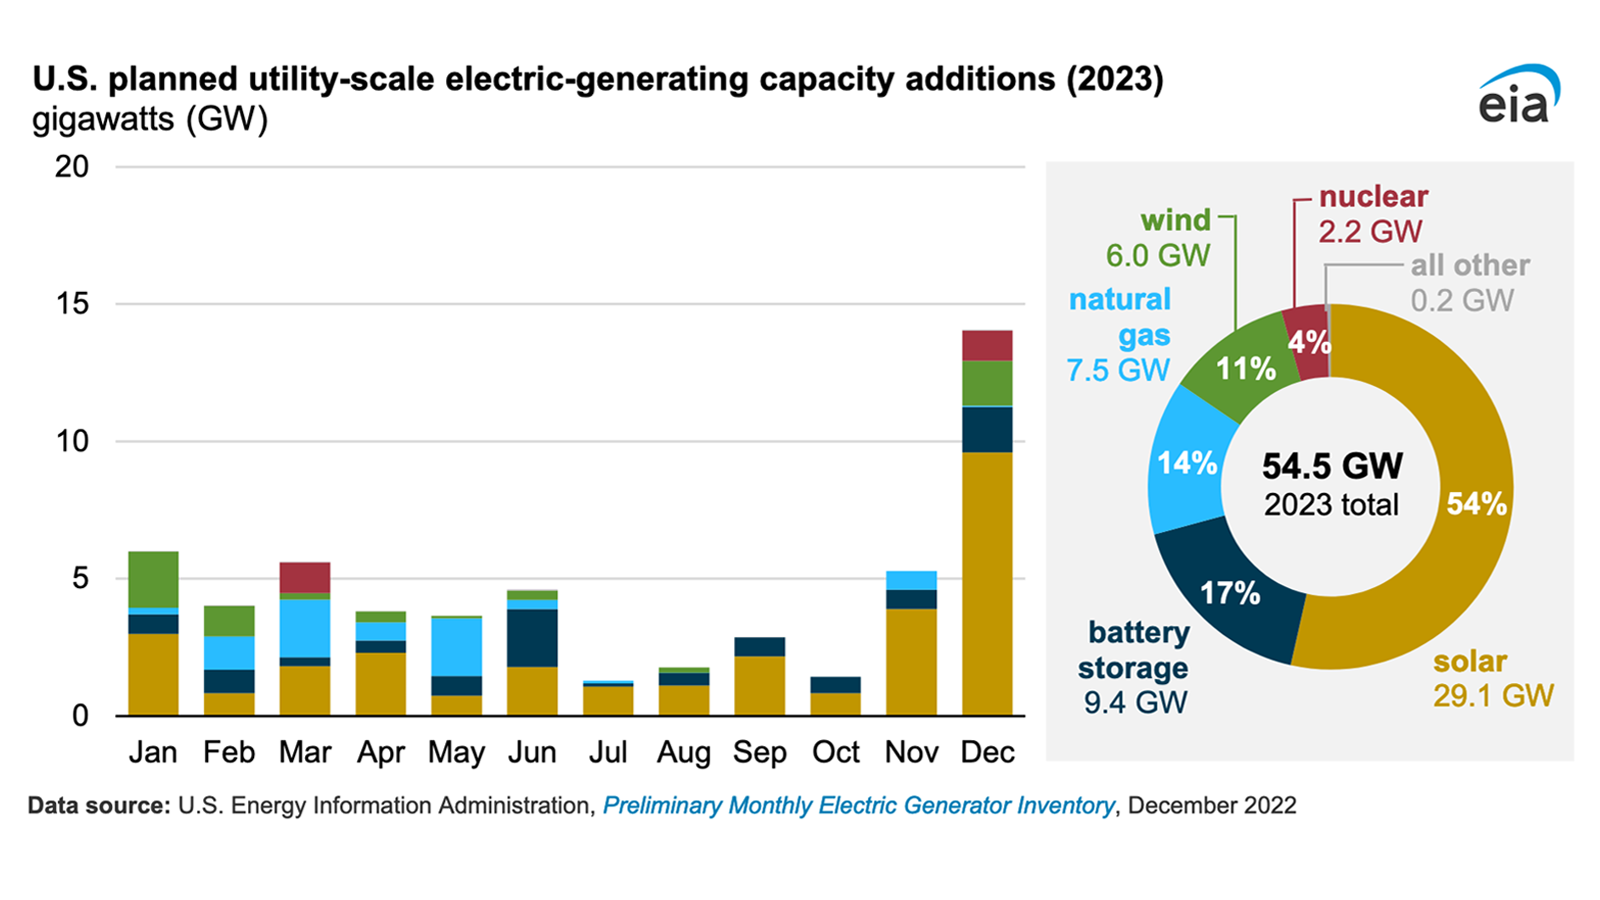
EIA Solar Generation Capacity, 2023 Forecast

In late 2022, the EIA forecast 29.1 gigawatts (GW) of new solar power electric-generating capacity to be added to the U.S. power grid in 2023

The EIA breaks down solar production according to the size of the plant. Large grid-scale facilities — facilities with 1 megawatt or greater generation capacity — have their production tracked, giving the EIA hard numbers. Smaller installations — such as residential solar are frequently “behind the meter” so the EIA estimates this solar production by tracking lower-than-expected power consumption.

Residential solar made big gains across the U.S. last year, with California leading the way in added solar generation capacity and Texas coming in a close second. Californians are increasingly combining residential solar generation with battery storage, making their homes more resilient from power outages.

For the first five months of 2024, utility-scale solar energy production rose by 29 percent compared to the same period of 2023. Small-scale solar was estimated to have increased by 18 percent, with the combined categories of solar power rising by 25.3 percent, compared to the first five months of 2023.
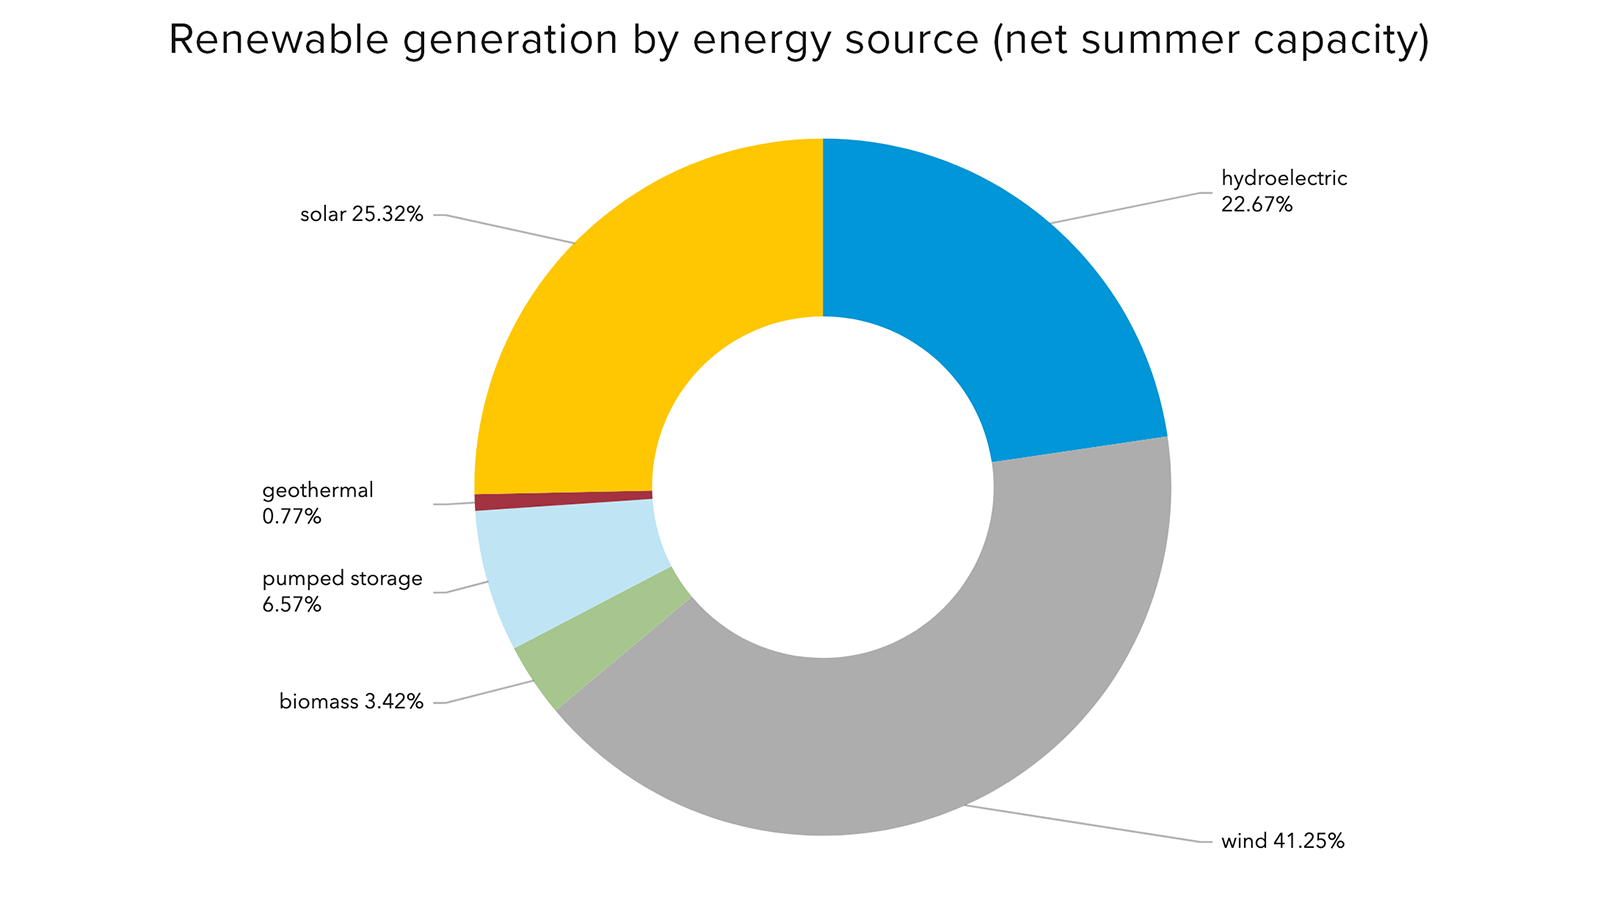
Renewable generation by energy source, summer capacity

Source: EIA Renewable Electricity Infrastructure and Resources Dashboard

U.S. solar power generation peaks during the longer daylight hours of the summer months; for this year utility-scale solar electric generation is expected to be 89.5 megawatts. Of renewable sources, only wind power (145.7 megawatts, 41.25%) generation is expected to exceed solar power.

Related:

Renewable Electricity Infrastructure and Resources Dashboard (EIA)

Share this entry
  • Share on Facebook
  • Share on X
  • Share on WhatsApp
  • Share on LinkedIn
  • Share by Mail
https://www.verdewatts.com/wp-content/uploads/2024/07/eia-solar-generation-forecast.png 900 1600 verdewatts https://www.verdewatts.com/wp-content/uploads/2015/10/verdewatts_logo.png verdewatts2024-07-29 06:51:082024-07-26 17:01:07U.S. Solar Production Booming for 2024 YTD
Search Search

Greenhouse Gas Calculator

Convert emissions or energy data into concrete terms you can understand — such as the annual CO2 emissions of cars, households, and power plants.

Quick Links

  • MicroGrid Systems
  • Power Purchase Agreement
  • Net Zero Carbon & LEEDs
  • Smart Digital City
  • EnerSync Power Hub
  • Energy Storage
  • About Us
  • Contact Us
Search Search

Our Location

VerdeWatts, LLC
2901 West Coast Hwy., Suite 200
Newport Beach, CA, 92663
Tel: +1-949-270-2941
Fax: +1-888-343-8357

© 2013 – 2024 VerdeWatts   Site Admin
  • Link to X
  • Link to LinkedIn
Link to: Green Solutions for EV Charging Link to: Green Solutions for EV Charging Green Solutions for EV ChargingGreen EV charging with clean energy infrastructure Link to: Navigating the Heat: How Extreme Weather is Impacting Our Electric Grid Link to: Navigating the Heat: How Extreme Weather is Impacting Our Electric Grid High transmission power lines cross a desert area.Bureau of Land Management, Public DomainNavigating the Heat: How Extreme Weather is Impacting Our Electric Grid
Scroll to top Scroll to top Scroll to top

This site uses cookies. By continuing to browse the site, you are agreeing to our use of cookies. Learn more on our Privacy Policy Page.

Learn MoreGot it!

Cookie and Privacy Settings


How we use cookies

We may request cookies to be set on your device. We use cookies to let us know when you visit our websites, how you interact with us, to enrich your user experience, and to customize your relationship with our website.

Click on the different category headings to find out more. You can also change some of your preferences. Note that blocking some types of cookies may impact your experience on our websites and the services we are able to offer.

Essential Website Cookies

These cookies are strictly necessary to provide you with services available through our website and to use some of its features.

Because these cookies are strictly necessary to deliver the website, refusing them will have impact how our site functions. You always can block or delete cookies by changing your browser settings and force blocking all cookies on this website. But this will always prompt you to accept/refuse cookies when revisiting our site.

We fully respect if you want to refuse cookies but to avoid asking you again and again kindly allow us to store a cookie for that. You are free to opt out any time or opt in for other cookies to get a better experience. If you refuse cookies we will remove all set cookies in our domain.

We provide you with a list of stored cookies on your computer in our domain so you can check what we stored. Due to security reasons we are not able to show or modify cookies from other domains. You can check these in your browser security settings.

Google Analytics Cookies

These cookies collect information that is used either in aggregate form to help us understand how our website is being used or how effective our marketing campaigns are, or to help us customize our website and application for you in order to enhance your experience.

If you do not want that we track your visit to our site you can disable tracking in your browser here:

Other external services

We also use different external services like Google Webfonts, Google Maps, and external Video providers. Since these providers may collect personal data like your IP address we allow you to block them here. Please be aware that this might heavily reduce the functionality and appearance of our site. Changes will take effect once you reload the page.

Google Webfont Settings:

Google Map Settings:

Google reCaptcha Settings:

Vimeo and Youtube video embeds:

Other cookies

The following cookies are also needed - You can choose if you want to allow them:

Privacy Policy

You can read about our cookies and privacy settings in detail on our Privacy Policy Page.

Privacy Policy
Accept settingsHide notification only